PowerSchool SIS Dashboard
Visualize your district’s performance with our set of highly informative dashboards, fully integrated into PowerSchool.

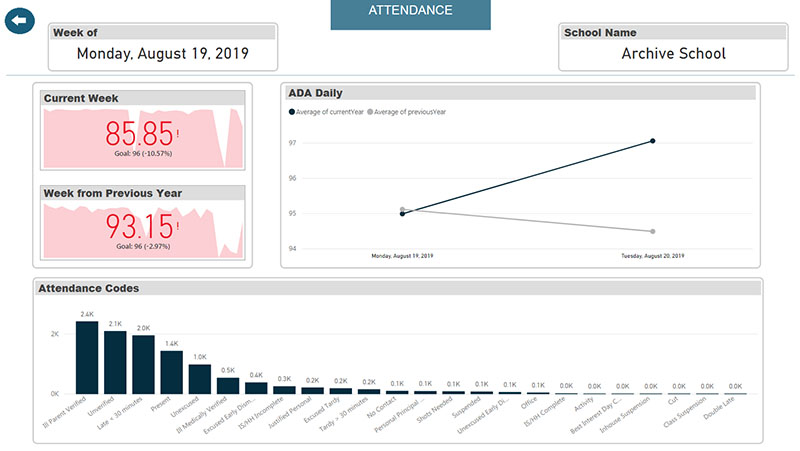
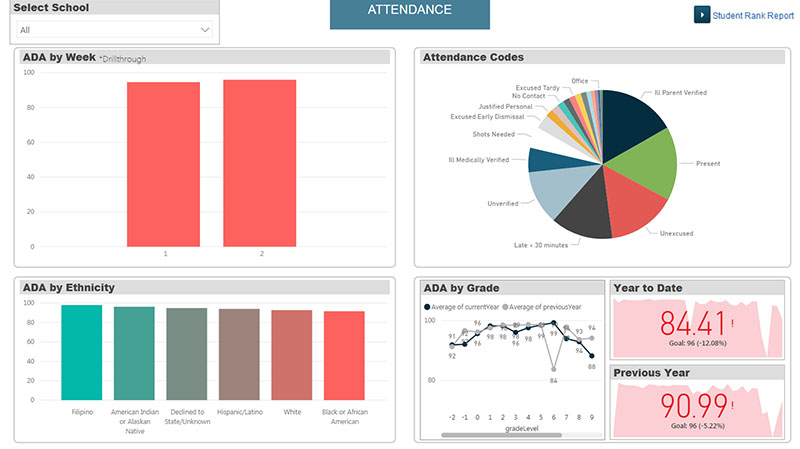
Visualize District Attendance, Behavior, and Discipline Data
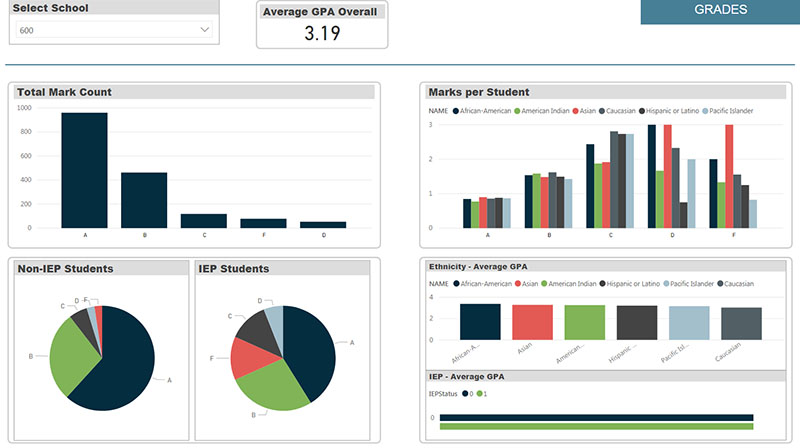
Our primary set of dashboards includes general attendance data, behavior data, and GPA, so you can meet your districtwide attendance goals. You can break the information down by school, grade, gender, and ethnicity. By visualizing the data, you can identify trends in your district so you can implement real changes.
In addition to our core data visualizations, our team can customize data that is relevant to your district and state. With our experience as state compliance developers and Microsoft partners, our team has the expertise to create any custom dashboard your district needs to assess your goals.
See Real Time Statistics Using Our Custom Dashboard
Visualize your data with our PowerSchool Dashboards, starting at just $199 per year!
PowerSchool Insights & News

CTS Now Offers Services for PowerSchool Products at a lower rate!
Capitol Tech Solutions is now able to offer our high-quality PowerSchool customization and training services at a new lower rate. Our team has over...

Capitol Tech Solutions Achieves PowerSchool Unified Classroom Training Certification
Capitol Tech Solutions SIS Division recently achieved certification for PowerSchool Unified Classroom Training. This certification broadens...

Top 5 PowerSchool Administrator Best Practices
Take advantage of powerful tools for your school district by implementing these PowerSchool best practices. PowerSchool is a powerful platform that...
More PowerSchool Services We Provide
Streamline your district’s performance monitoring with our PowerSchool dashboard.
